

Driving for Dollars on Autopilot
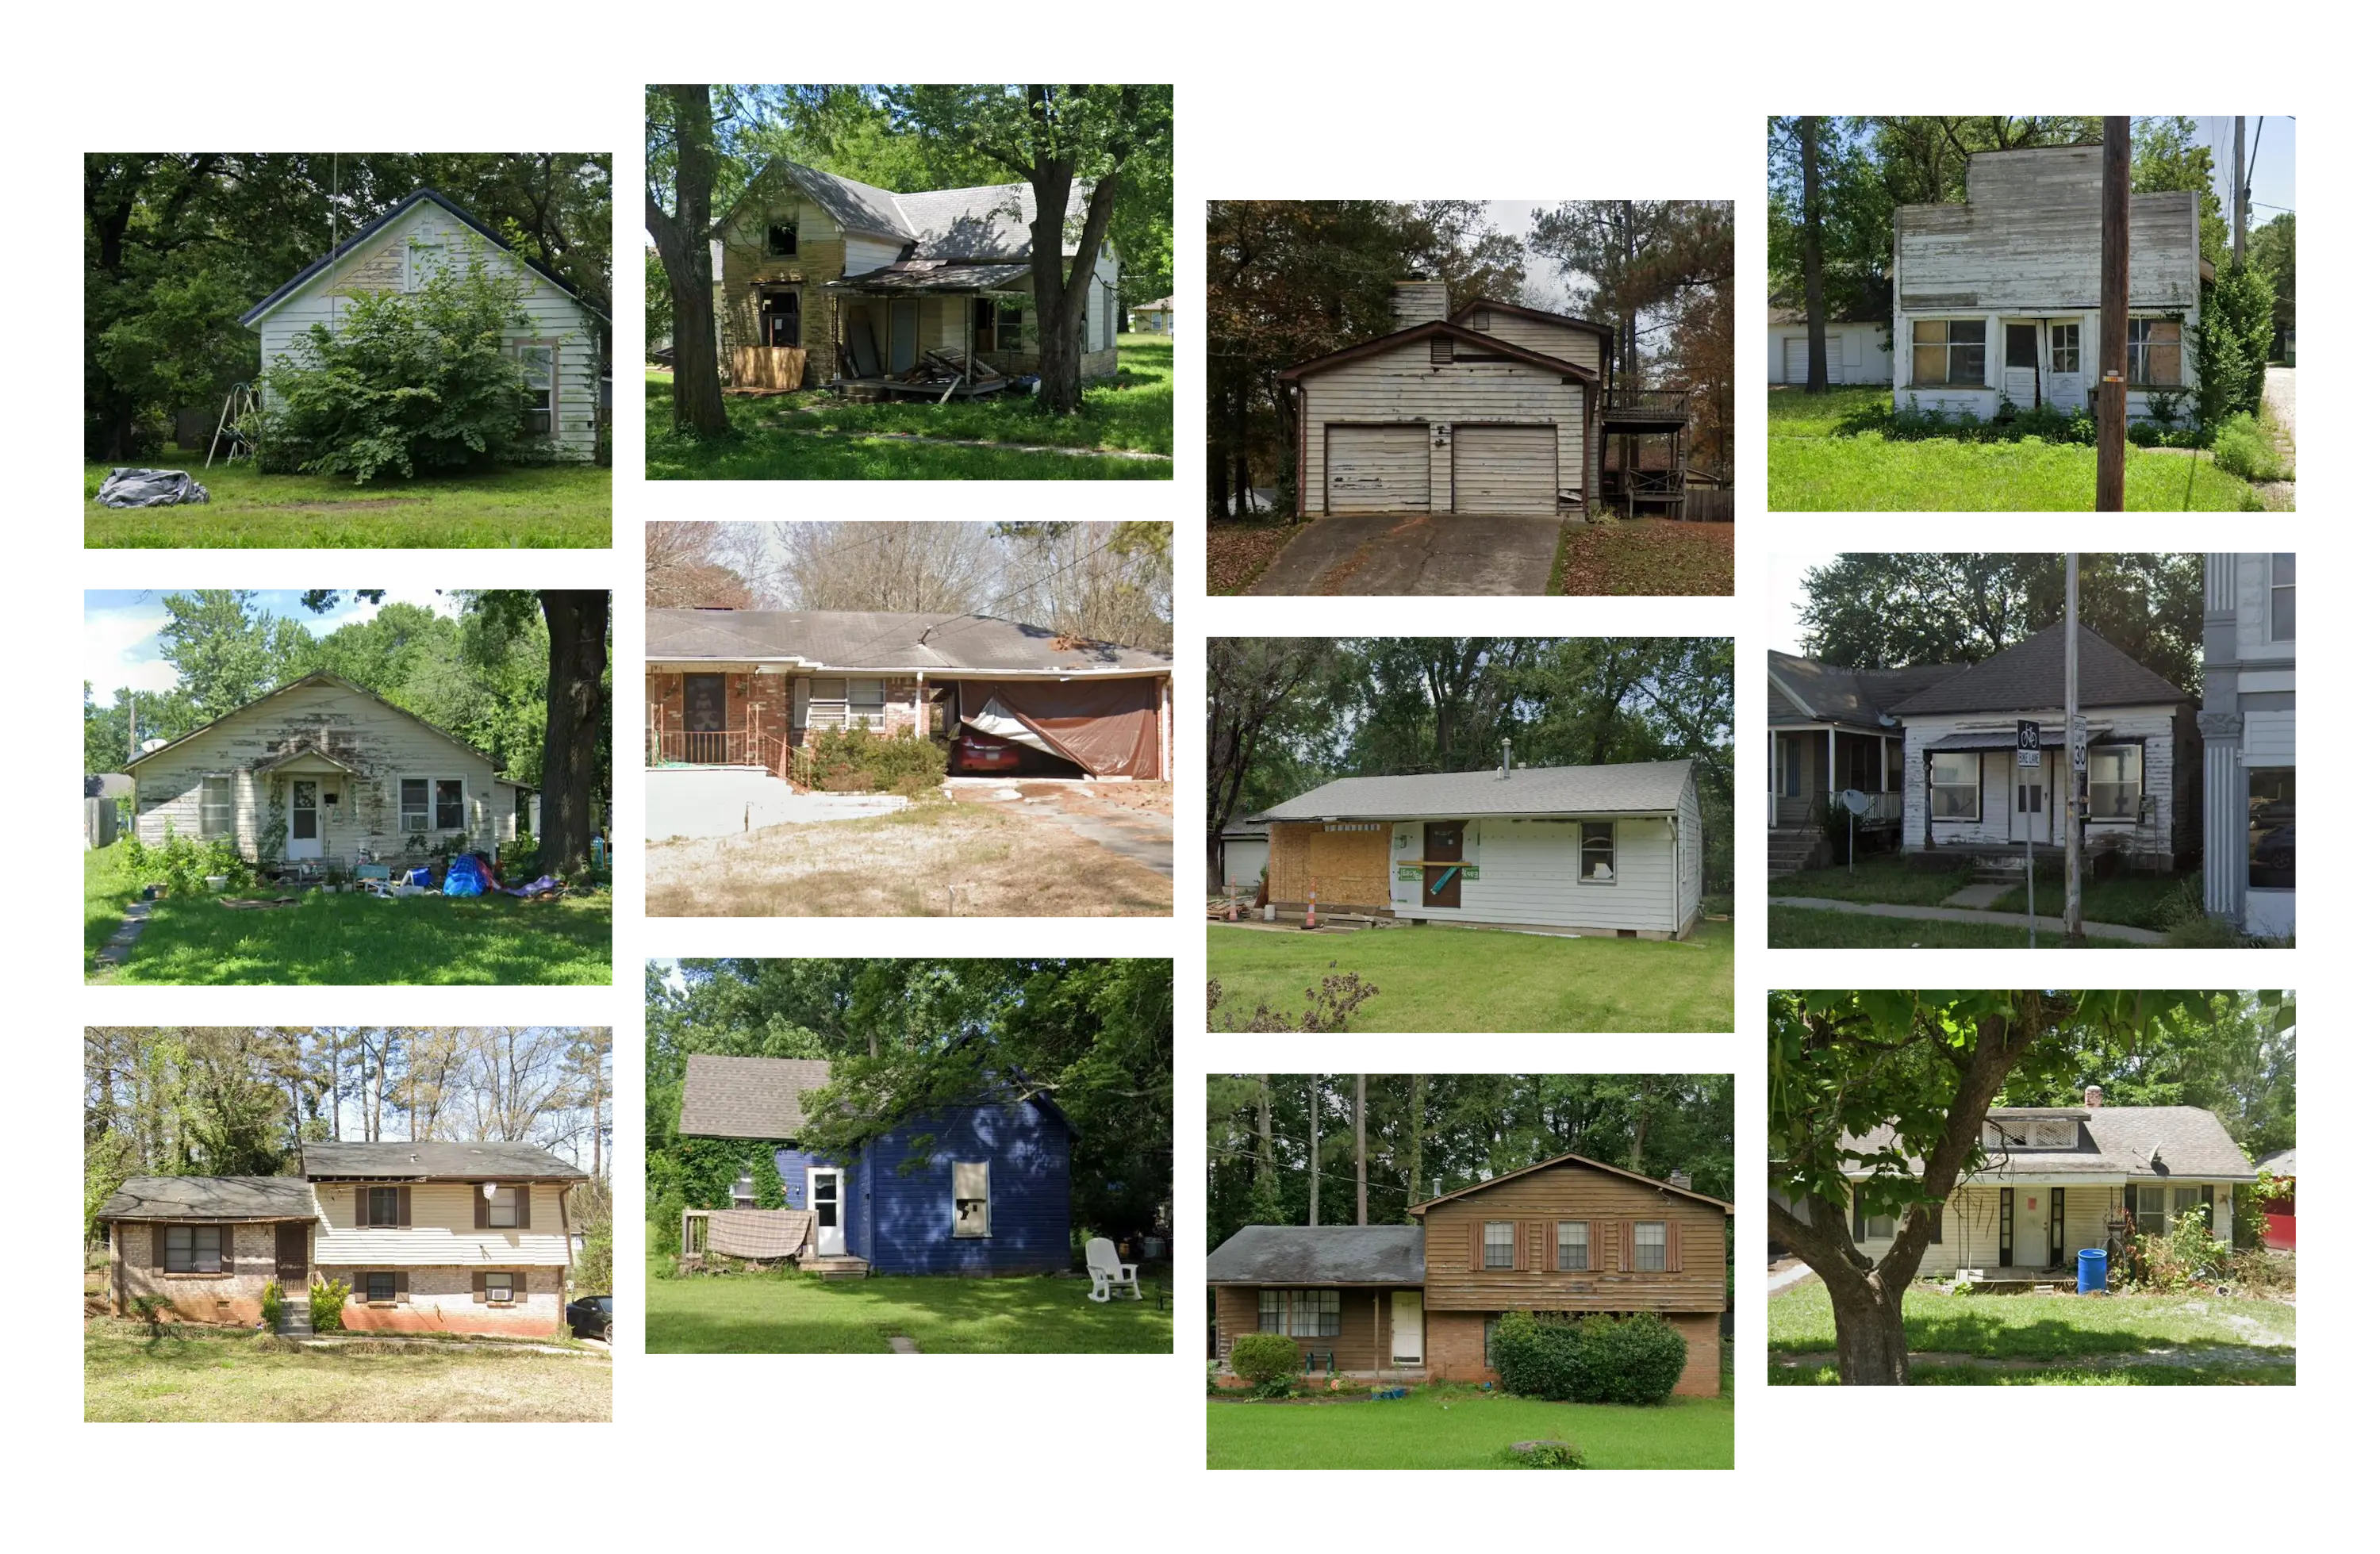
These are all real examples of properties discovered by our tool.
Find all visibly distressed properties in your markets. Our AI scans streetview images to identify distressed properties with high investment potential.
of manual driving and property scouting
others miss with our multi-angle property analysis
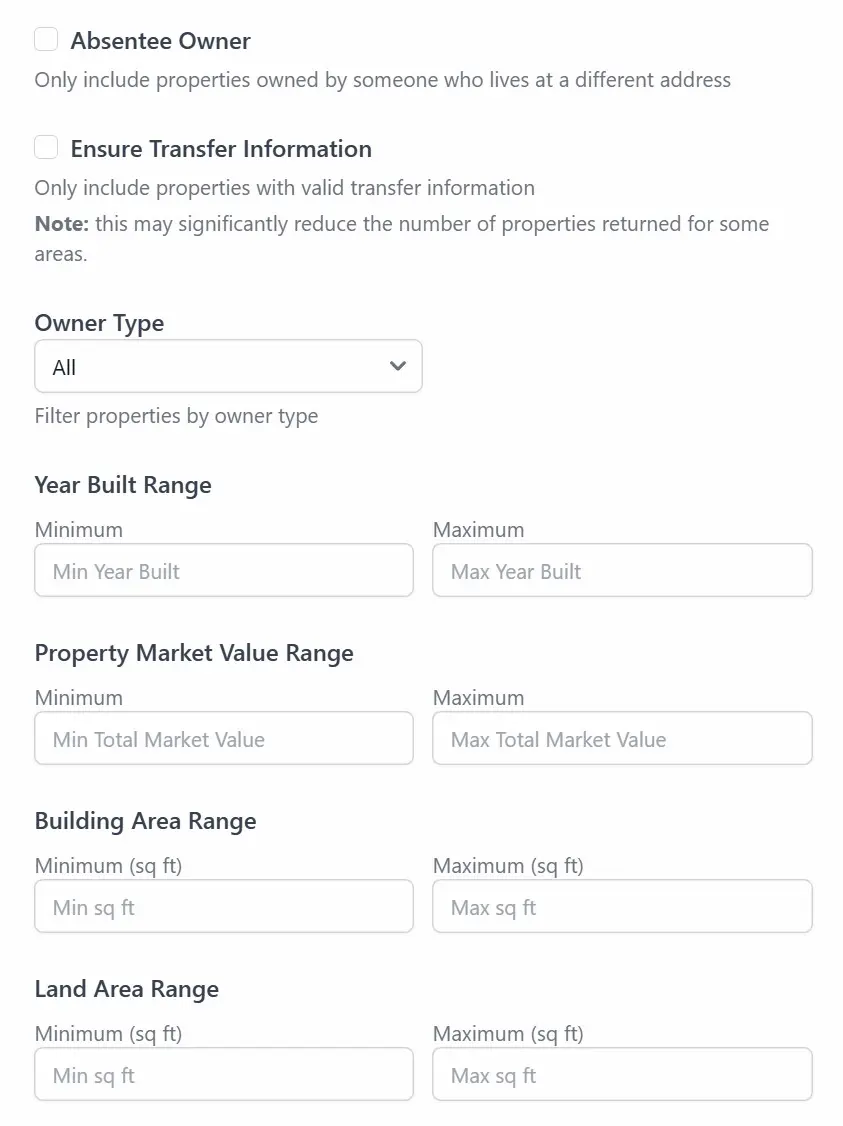
with filters for absentee owners, property age, market value, and more
with distress scores (0-100) and comprehensive tax assessment data
by analyzing entire zip codes or your existing lead lists
use our web application to run jobs and access your data at any time.
"It's like having a virtual driving team working 24/7 to find your next profitable deal."
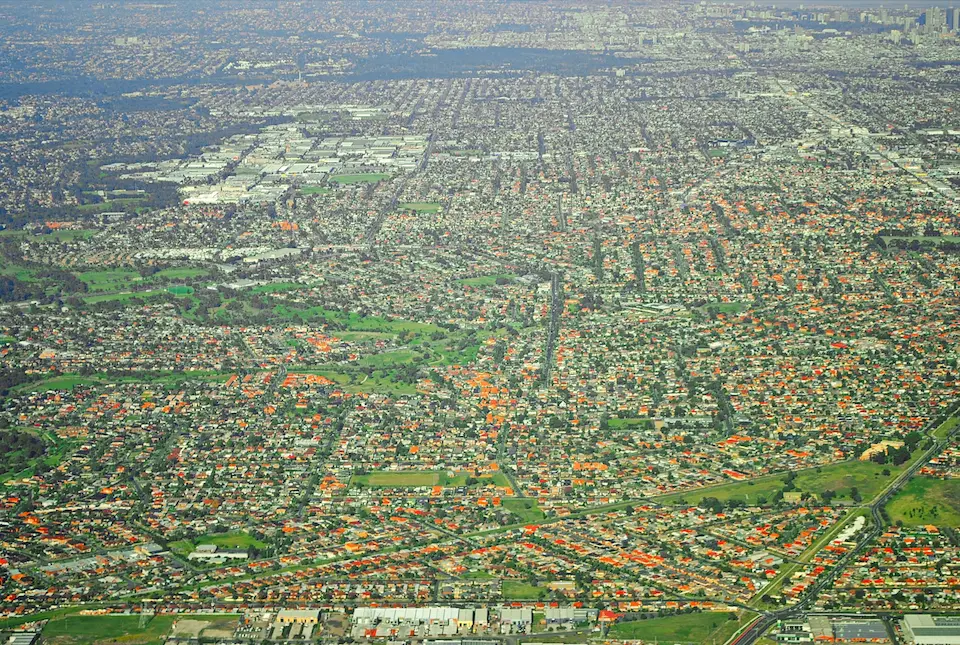
Find distressed property leads in your market by running an area search over 100 million residential properties in the US.
Our AI analyzes properties, assigning a distress score from 0 to 100, determined from up to 3 recent streetview images. Old streetview images are mitigated by checking the last transfer date of the property.
All results come with additional tax assessment information from public records.
Available in all US states.
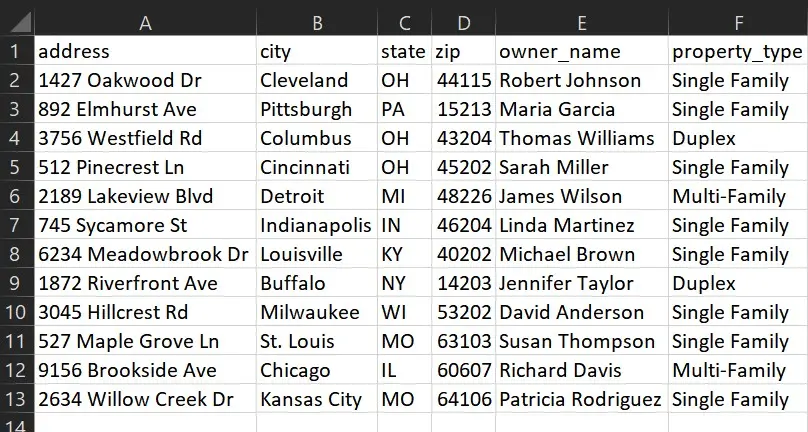
Upload a CSV file with addresses to have their distress level analyzed. All you need is an address, state and zip code.
In addition to a distress score, we will augment your data with available property information from tax assessment records.
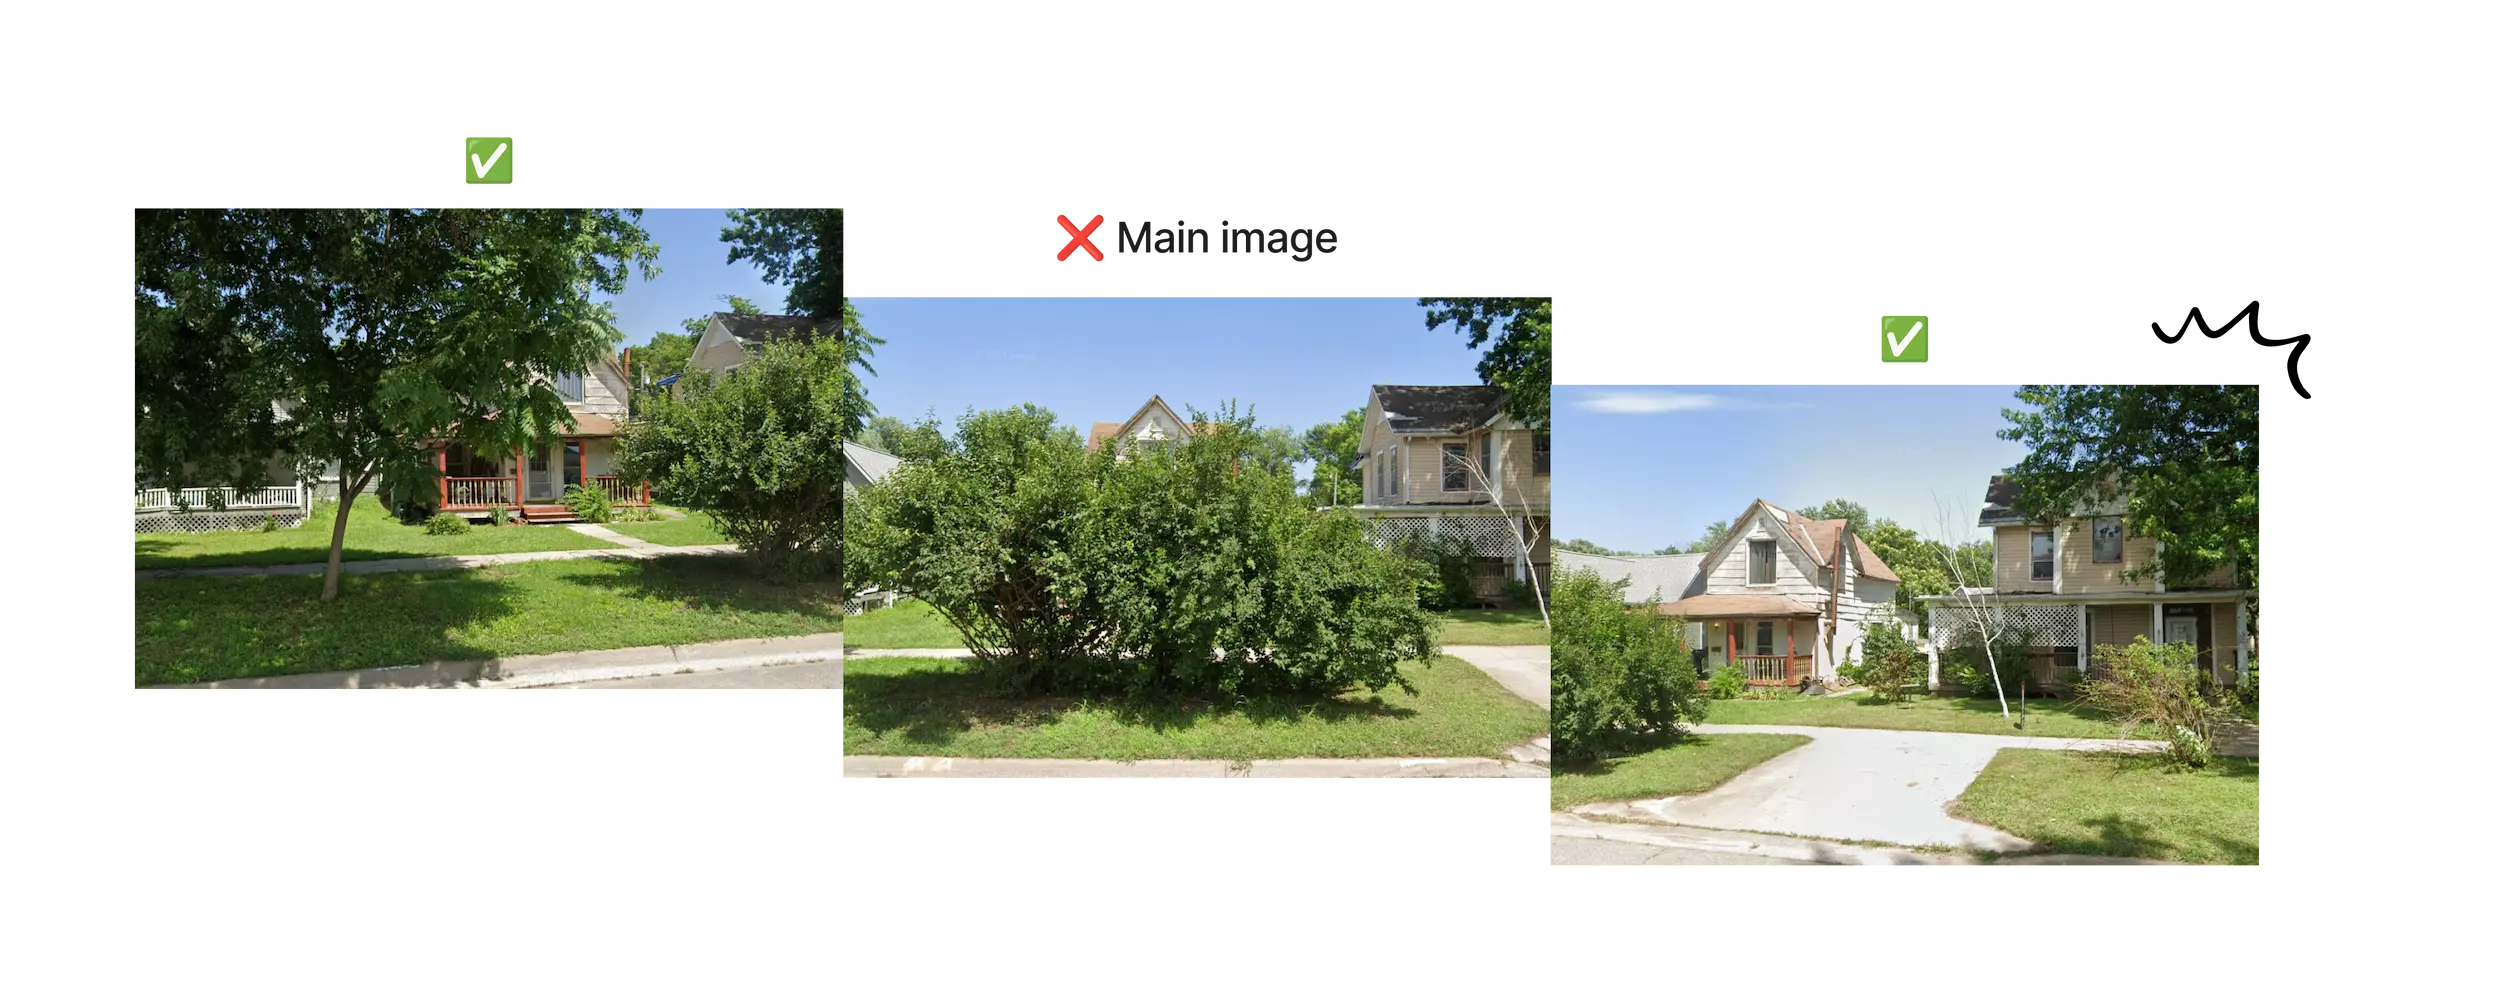
We take up to 3 images of each property, so you can literally see around obstacles and never miss a good candidate.
We make sure to use images from after the last transfer date, reducing the chances of it having been renovated since.
Narrow down the properties that meet your investment criteria with filters.
Our property data is updated quarterly to ensure the most accurate and up-to-date information.
You consume credits for each property analyzed.
The dollar cost of credits depends on your plan.
For Area search, 1 property analyzed = 1 credit
For CSV files, 1 property analyzed = 4 credits
| Feature | Explore | Base | Boss |
|---|---|---|---|
| Subscription price | $0 / month | $30 / month | $60 / month |
| Credits Included | | 6,000 / month | 20,000 / month |
| Additional credits | $0.04 | $0.03 | $0.02 |
| Upload your CSVs | |||
| Property filters | |||
| Multiple ZIPs per job | | ||
| Max properties per job | 15,000 | 75,000 | 200,000 |
| Concurrent jobs | 1 | 5 | 10 |
Through our self-serve web application, you can:
Our AI then collects Streetview images of the properties and computes their distress score, helping you identify investment opportunities.
Browse the results in our web application, where you can filter and sort the properties, and download the results as an Excel file, to load back into your CRM or other system.

Find answers to common questions about our services.
We make sure to use images from AFTER the property's last transfer, which reduces the chances of it having been renovated. If the property does not have transfer information, we apply a hard cutoff date of 2014 as the images were of much lower quality before then.
While AI isn't perfect, we have found it to consistently give great results at identifying distressed properties, often spotting subtle details that could evade the human eye. You can expect a few false positive results, but few false negatives, meaning less chances of missing a distressed property. The tool might also perform better in less dense areas, where less objects are in the field of vision
Our current data sources only cover the US, but contact us if you are interested in a similar service for your country.
Your CSV file must include Address, State and Zip Code. Other fields can be present but will be ignored. We try to find your property using our data provider, and fallback to Google Maps if necessary.
Area searches cost 1 credit per property returned, while CSV searches cost 4 credits per property returned. These two modes have different cost structures on our end, which is reflected in their credit cost.
No, unused credits do not currently rollover to the next month.